Budget Overview
The budget overview at Budget > Overview is a single-page report of your project's costs, grouped by area hierarchy rather than by category. It rolls everything up from individual budget lines through work items and household items into a clean, printable view of where your money is going -- and which financing source is funding each line.
Page Layout
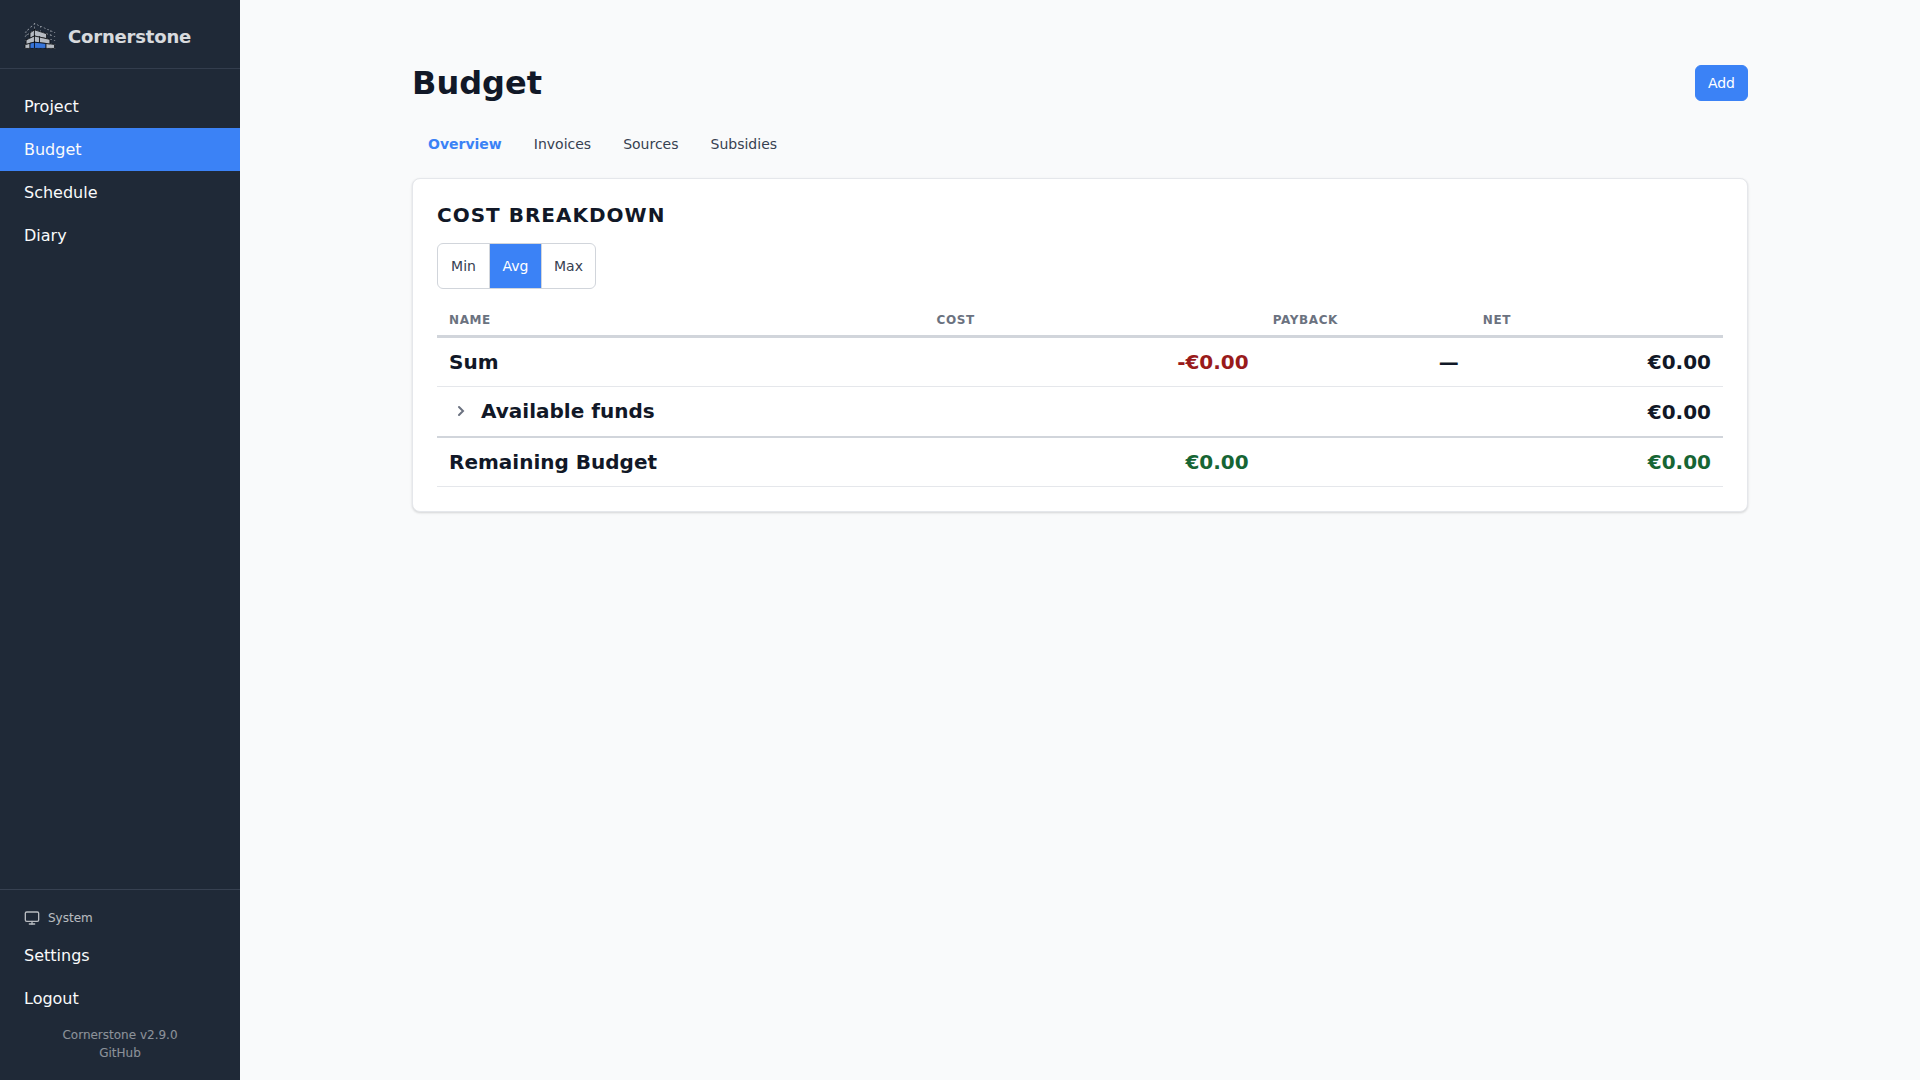
The page renders the Cost Breakdown Table as its primary view, with a per-source filter, a min / avg / max perspective toggle inside the table, and a built-in Available Funds row that summarizes each financing source.
If your project has no budget data yet, you see a short empty state inviting you to add work items, household items, or invoices. Once you have a few budget lines, the breakdown takes over the page.
Cost Breakdown by Area
The cost breakdown table is grouped by your area hierarchy rather than by category. This makes it easy to see what each room, floor, or zone of the project actually costs.
- Each area is a row. Its totals roll up every descendant area beneath it.
- Clicking a row expands it to show child areas and, at the leaf level, the individual budget lines.
- Nested rows are visually indented so the tree is easy to scan.
- Budget lines whose work item or household item has no area assigned are collected in a dedicated No Area bucket at the bottom of the table.
Each row displays the projected cost, subsidy payback, and remaining amount for that slice of the project.
Cost Perspectives
A Min / Avg / Max segmented control above the table switches the projected-cost calculation between three views:
| Perspective | What It Tells You |
|---|---|
| Min | Best-case cost assuming all estimates come in under their confidence margin |
| Avg | Mid-point cost using the middle of each estimate's confidence range |
| Max | Worst-case cost assuming all estimates come in over their confidence margin |
Switch between perspectives to understand your financial position from different angles. Early in a project, Min and Max bracket your exposure. As invoices arrive and confidence levels rise, the three views converge.
How Projections Work
The breakdown uses a blended projection model that combines estimates and actuals:
- Budget lines linked to a paid, pending, or claimed invoice use the itemized invoice amount (0% margin)
- Budget lines linked to a quotation use the itemized amount with a +/- 5% margin
- Budget lines without an invoice link use the planned amount with the confidence margin
The margin applied to non-invoiced budget lines depends on the confidence level:
| Confidence Level | Margin |
|---|---|
| Own Estimate | +/- 20% |
| Professional Estimate | +/- 10% |
| Quote | +/- 5% |
| Invoice | 0% (actual cost used) |
This means projections automatically become more accurate as your project progresses and estimates are replaced by real invoices.
Source Attribution Badges
Every leaf-level budget line carries a source attribution badge so you can see at a glance which financing source funds each line:
- Each source is assigned a deterministic color from a 10-slot palette -- the same source always gets the same color across the table, between sessions, and in both light and dark mode.
- On desktop, the badge shows the full source name next to a colored dot (long names are truncated with the full name available on hover).
- On mobile, only the colored dot is shown to keep the row compact; tapping the line still opens the full detail.
- Lines without a source assignment are shown with a neutral "Unassigned" badge in a reserved color slot.
Available Funds Row
The cost breakdown includes a dedicated Available Funds row at the top of the totals section. Click the row to expand it and see one line per financing source, with three columns:
- Cost -- how much of that source has been allocated to budget lines (perspective-aware: switches between min, max, and average projection)
- Payback -- the subsidy payback expected against budget lines funded from this source
- Net -- the remaining headroom on that source after subtracting cost and adding back payback
This makes it easy to spot which source is most depleted, which one is being subsidized, and which one still has slack -- all in a single glance.
Filter by Source
Click any source detail row inside the Available Funds expansion to toggle that source on or off. Deselected sources are dropped from the entire breakdown:
- The projected cost range, every nested area row, and the Available Funds and Remaining Budget (Cost + Net) totals all recalculate against the visible set in real time as you toggle.
- A small "X of N selected" caption appears next to Available Funds while a filter is active.
- The selection is persisted in the URL as
?deselectedSources=<id>,<id>so you can bookmark a filtered view, share it with your bank or partner, or refresh without losing state. - Press Escape while focused on a source row to clear all deselections in one go.
- Source detail rows stay visible even when every source is deselected -- the filter is never a dead-end; you can always click your way back in.
- When you print a filtered view, deselected source rows are hidden from the printed output so the report only shows the sources you actually have selected.
Filtering happens server-side (GET /api/budget/breakdown?deselectedSources=...), which means subsidy payback math stays consistent with the visible set: subsidies that no longer have any qualifying budget lines drop out cleanly instead of double-counting.
Subsidy Impact
Approved and disbursed subsidies are factored into the breakdown calculations. The Available Funds row shows how much each subsidy reduces the net cost for its linked source. Pending and rejected subsidies are excluded from calculations.
Printing the Overview
The Budget Overview has dedicated print styling so you can hand your bank, accountant, or partner a clean PDF or paper copy.
- Use your browser's Print command (
Cmd+Pon macOS,Ctrl+Pon Windows/Linux) directly from the overview page. - The app chrome -- sidebar, navigation, floating buttons -- is suppressed in print.
- Page margins, title spacing, and nested area group boxes are tuned for A4/Letter output.
- Inner item separators keep individual budget lines readable when an area group contains many children.
- Source attribution badges keep their full source name on the printed page, with a border-based color treatment so the source is legible even if your printer doesn't preserve background colors.
- The browser's own print header/footer is suppressed; pick your target (printer or "Save as PDF") and go.
If the exported PDF does not match what you see on screen, make sure your browser's "Background graphics" option is enabled in the print dialog -- the nested group boxes rely on background color to stay legible.
Related Pages
- Work Items — track progress and link budget lines to construction tasks
- Household Items — manage furniture and appliance purchases with their own budget lines
- Financing Sources — detailed view of each financing source and its allocated lines
- Subsidies — manage subsidy applications and their impact on your budget