Dashboard
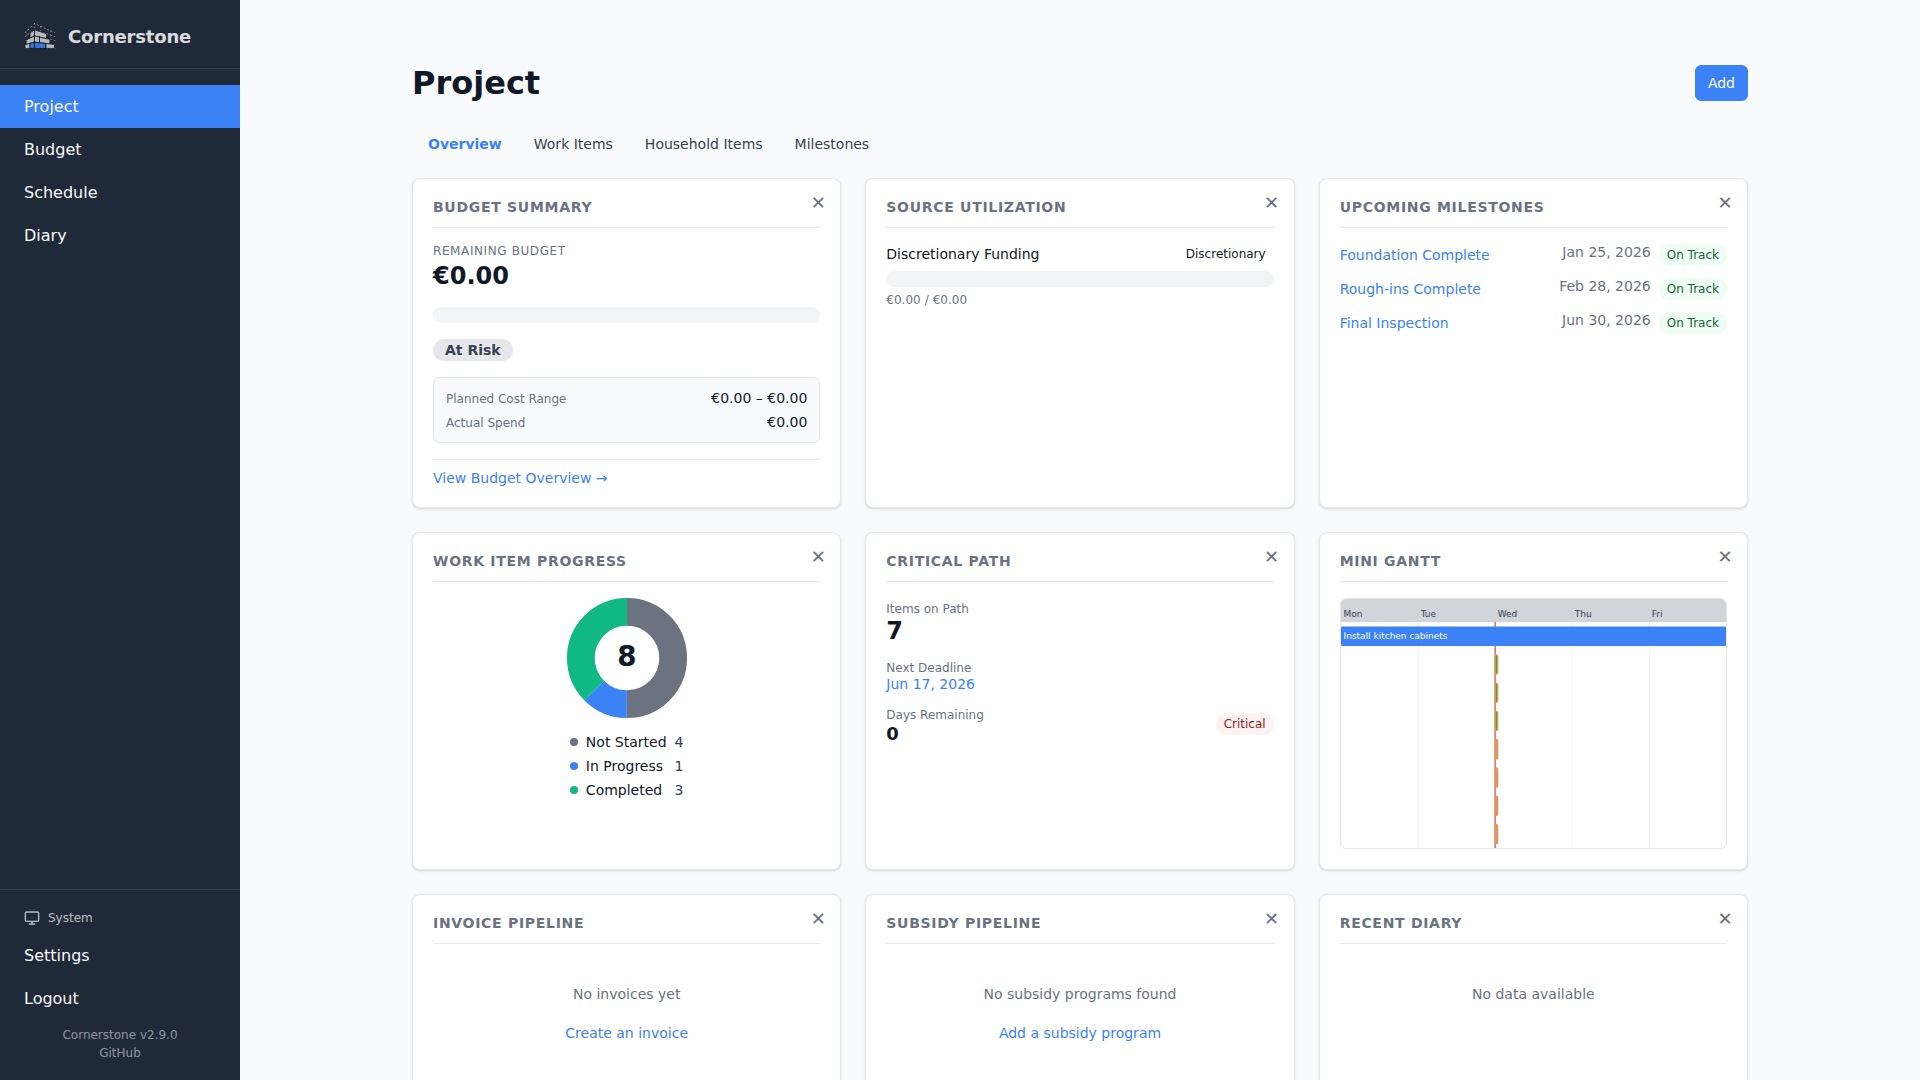
The project dashboard at Project > Overview gives you an at-a-glance view of your entire home building project. It pulls together budget health, timeline progress, invoices, and subsidies into a single page of card-based widgets.
Dashboard Cards
The dashboard is organized into cards, each focused on a specific aspect of your project:
| Card | What It Shows |
|---|---|
| Budget Summary | Available funds and remaining budget across four perspectives (min planned, max planned, actual cost, actual paid) |
| Budget Alerts | Warnings when a budget category's costs exceed its allocated amount |
| Source Utilization | Progress bars showing how much of each financing source has been used |
| Timeline Status | Work item counts by status and milestone progress |
| Mini Gantt | A compact 30-day Gantt chart preview -- click it to open the full Gantt chart |
| Invoice Pipeline | Breakdown of invoices by status (pending, paid, claimed) |
| Subsidy Pipeline | Status overview of your subsidy programs |
| Recent Diary | Latest diary entries with scrollable list -- click to open the full diary |
| Quick Actions | Navigation links to frequently used actions like creating work items or viewing the budget |
Customizing Your Dashboard
You can dismiss any card you do not need by clicking the dismiss button on that card. Dismissed cards are saved to your user preferences and persist across sessions.
To bring back a hidden card:
- Click the Customize button in the page header (this button only appears when at least one card is hidden)
- Select the card you want to re-enable from the dropdown menu
Each user's dashboard layout is independent -- dismissing a card only affects your own view.
Mobile Layout
On smaller screens, the dashboard switches from a flat grid to a sectioned layout:
- Primary cards (Budget Summary, Budget Alerts, Invoice Pipeline, Recent Diary, Quick Actions) are always visible
- Timeline cards (Timeline Status, Mini Gantt) are grouped under a collapsible "Timeline" section with a summary line
- Budget Details cards (Source Utilization, Subsidy Pipeline) are grouped under a collapsible "Budget Details" section
Tap a section header to expand or collapse it.
Error Handling
If a data source fails to load, the affected card shows an error message with a Retry button. Other cards continue to display normally -- a failure in one area does not block the rest of the dashboard.
Cards that have no data to show (for example, the Invoice Pipeline when no invoices exist yet) display a helpful empty state message with a link to the relevant page where you can add data.
Accessibility
The dashboard uses ARIA landmarks and live regions so screen readers announce updates as data loads. All cards and controls are fully keyboard-navigable.