Gantt Chart
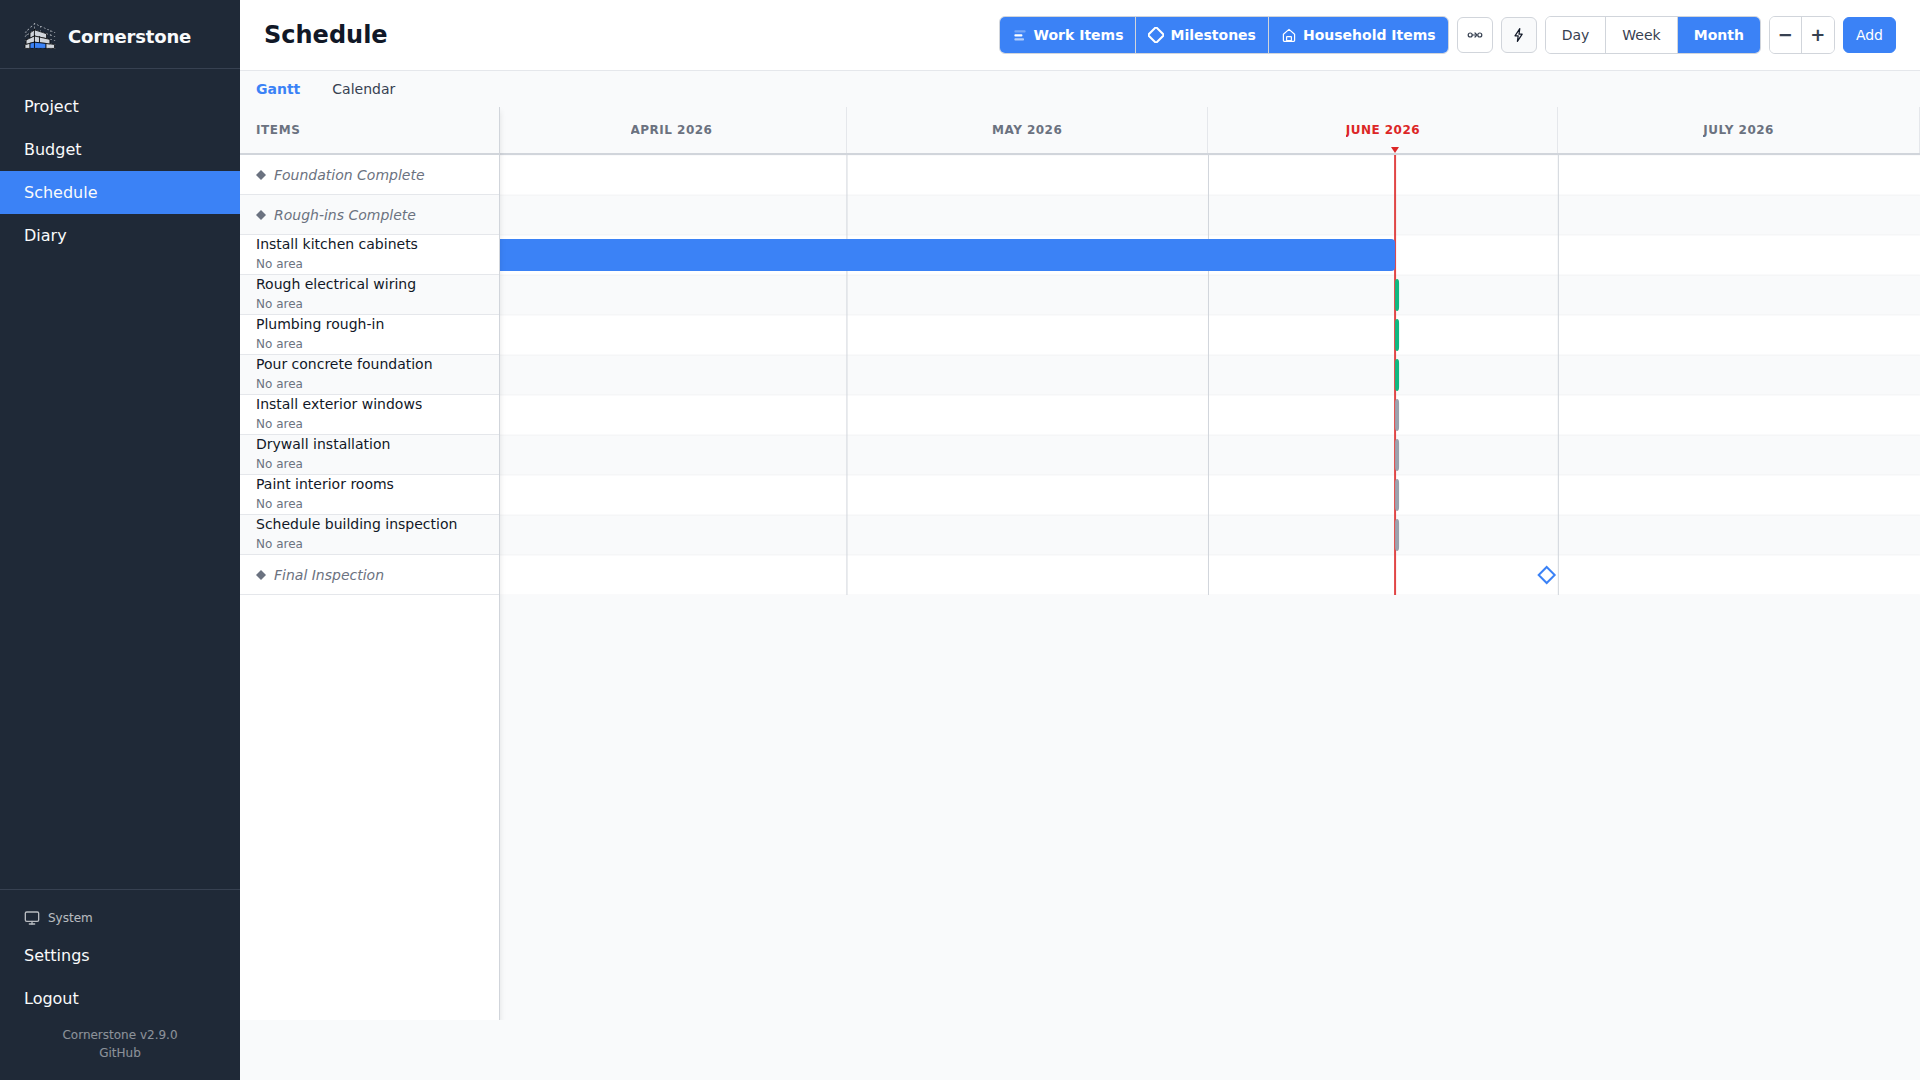
The Gantt chart is the primary timeline visualization in Cornerstone. It displays all work items with start and end dates as horizontal bars on a time axis, with dependency arrows showing relationships between tasks.
Accessing the Gantt Chart
Navigate to Timeline from the main navigation. The Gantt chart is the default view. You can switch between the Gantt chart and the Calendar View using the view toggle in the toolbar.
Chart Layout
The Gantt chart has three main areas:
- Sidebar -- A fixed-width panel on the left listing work item titles, one per row
- Time Grid -- The main area showing vertical grid lines for time periods and horizontal bars for each work item
- Header -- A date header row at the top showing the time scale (days, weeks, or months)
Each work item is displayed as a colored bar whose horizontal position and width represent its start date, end date, and duration. The bar color reflects the work item's status:
| Status | Color |
|---|---|
| Not Started | Blue |
| In Progress | Blue (primary) |
| Completed | Green |
| Blocked | Red/Warning |
Today Marker
A vertical line marks today's date on the chart, making it easy to see which tasks are in the past, present, or future.
Zoom Levels
The toolbar provides three zoom levels that control the time scale:
| Zoom | Grid Lines | Best For |
|---|---|---|
| Day | One column per day, major lines on Mondays | Short-term detail (next few weeks) |
| Week | One column per week, major lines on month boundaries | Medium-term planning (1-3 months) |
| Month | One column per month | Long-term overview (full project) |
Switch zoom levels using the Day / Week / Month toggle in the toolbar. The default zoom level is Month.
Column Width Adjustment
You can adjust how wide each time column is to zoom in or out within your selected zoom level:
- Click the - and + buttons in the toolbar
- Use Ctrl + = (zoom in) and Ctrl + - (zoom out) keyboard shortcuts
- Use Ctrl + scroll wheel while hovering over the chart
This gives you fine-grained control over how much of the timeline is visible at once.
Dependency Arrows
When work items have dependencies, the Gantt chart draws arrows between them to show the relationship. All four dependency types are visualized:
- Finish-to-Start (FS) -- Arrow from the end of the predecessor to the start of the successor
- Start-to-Start (SS) -- Arrow from the start of the predecessor to the start of the successor
- Finish-to-Finish (FF) -- Arrow from the end of the predecessor to the end of the successor
- Start-to-Finish (SF) -- Arrow from the start of the predecessor to the end of the successor
Arrow Interactions
- Hover over a bar to highlight all arrows connected to that work item
- Toggle arrows on or off using the connector icon button in the toolbar
Critical Path
The critical path is the longest chain of dependent tasks that determines the minimum project duration. Any delay on a critical path task delays the entire project.
- Critical path bars are highlighted with a distinct visual treatment
- Toggle critical path highlighting using the lightning bolt icon button in the toolbar
- Both the work item bars and their dependency arrows are highlighted when the critical path is active
Milestones on the Gantt Chart
Milestones appear as diamond markers on the Gantt chart at their target date position. Click a milestone diamond to open the milestone panel for editing.
Milestone diamonds are color-coded:
| State | Color |
|---|---|
| Incomplete (on track) | Blue outline |
| Late (projected date exceeds target) | Red/warning |
| Completed | Green, filled |
Tooltips
Hover over any work item bar or milestone diamond to see a tooltip with detailed information:
Work item tooltips show:
- Title and status
- Start and end dates
- Planned and actual duration
- Assigned user
- Dependency relationships (predecessors and successors)
Milestone tooltips show:
- Title and target date
- Projected completion date
- Contributing and dependent work items
- Completion status
Touch Devices
On touch devices, the Gantt chart uses a two-tap interaction:
- First tap -- Shows the tooltip for the tapped item
- Second tap -- Navigates to the work item detail page
This ensures you can always preview information before navigating away.
Scrolling and Navigation
- Horizontal scroll to move through time (the sidebar stays fixed)
- Vertical scroll to see more work items when the list is longer than the viewport
- The chart automatically scrolls to show the current date range when loaded
Responsive Behavior
The Gantt chart adapts to different screen sizes:
- Desktop -- Full sidebar with work item titles, wide chart area
- Tablet -- Narrower layout with all controls accessible
- Mobile -- Compact layout optimized for touch interaction
Keyboard Navigation
The Gantt chart supports keyboard navigation for accessibility:
- Arrow keys -- Navigate between bars
- Enter / Space -- Activate the focused bar (navigate to detail page)
- Escape -- Dismiss tooltips
- Ctrl + = / Ctrl + - -- Zoom in/out column width
Auto-Schedule
The scheduling engine automatically adjusts dates for work items that have not started yet. This happens:
- When you add or modify dependencies between work items
- When the server detects a new calendar day has begun (auto-reschedule)
The engine uses the Critical Path Method (CPM) and respects:
- All four dependency types (FS, SS, FF, SF)
- Lead and lag days on dependencies
- Start-after and start-before constraints on work items
- Actual start/end dates for in-progress or completed items (these are never moved)
Only work items with status Not Started are rescheduled automatically. In-progress and completed items keep their actual dates.