Timeline
The timeline page gives you a visual overview of your construction project schedule. It combines a Gantt chart, a calendar view, and milestone tracking into a single page so you can see what needs to happen, when, and in what order.
Overview
The timeline system provides:
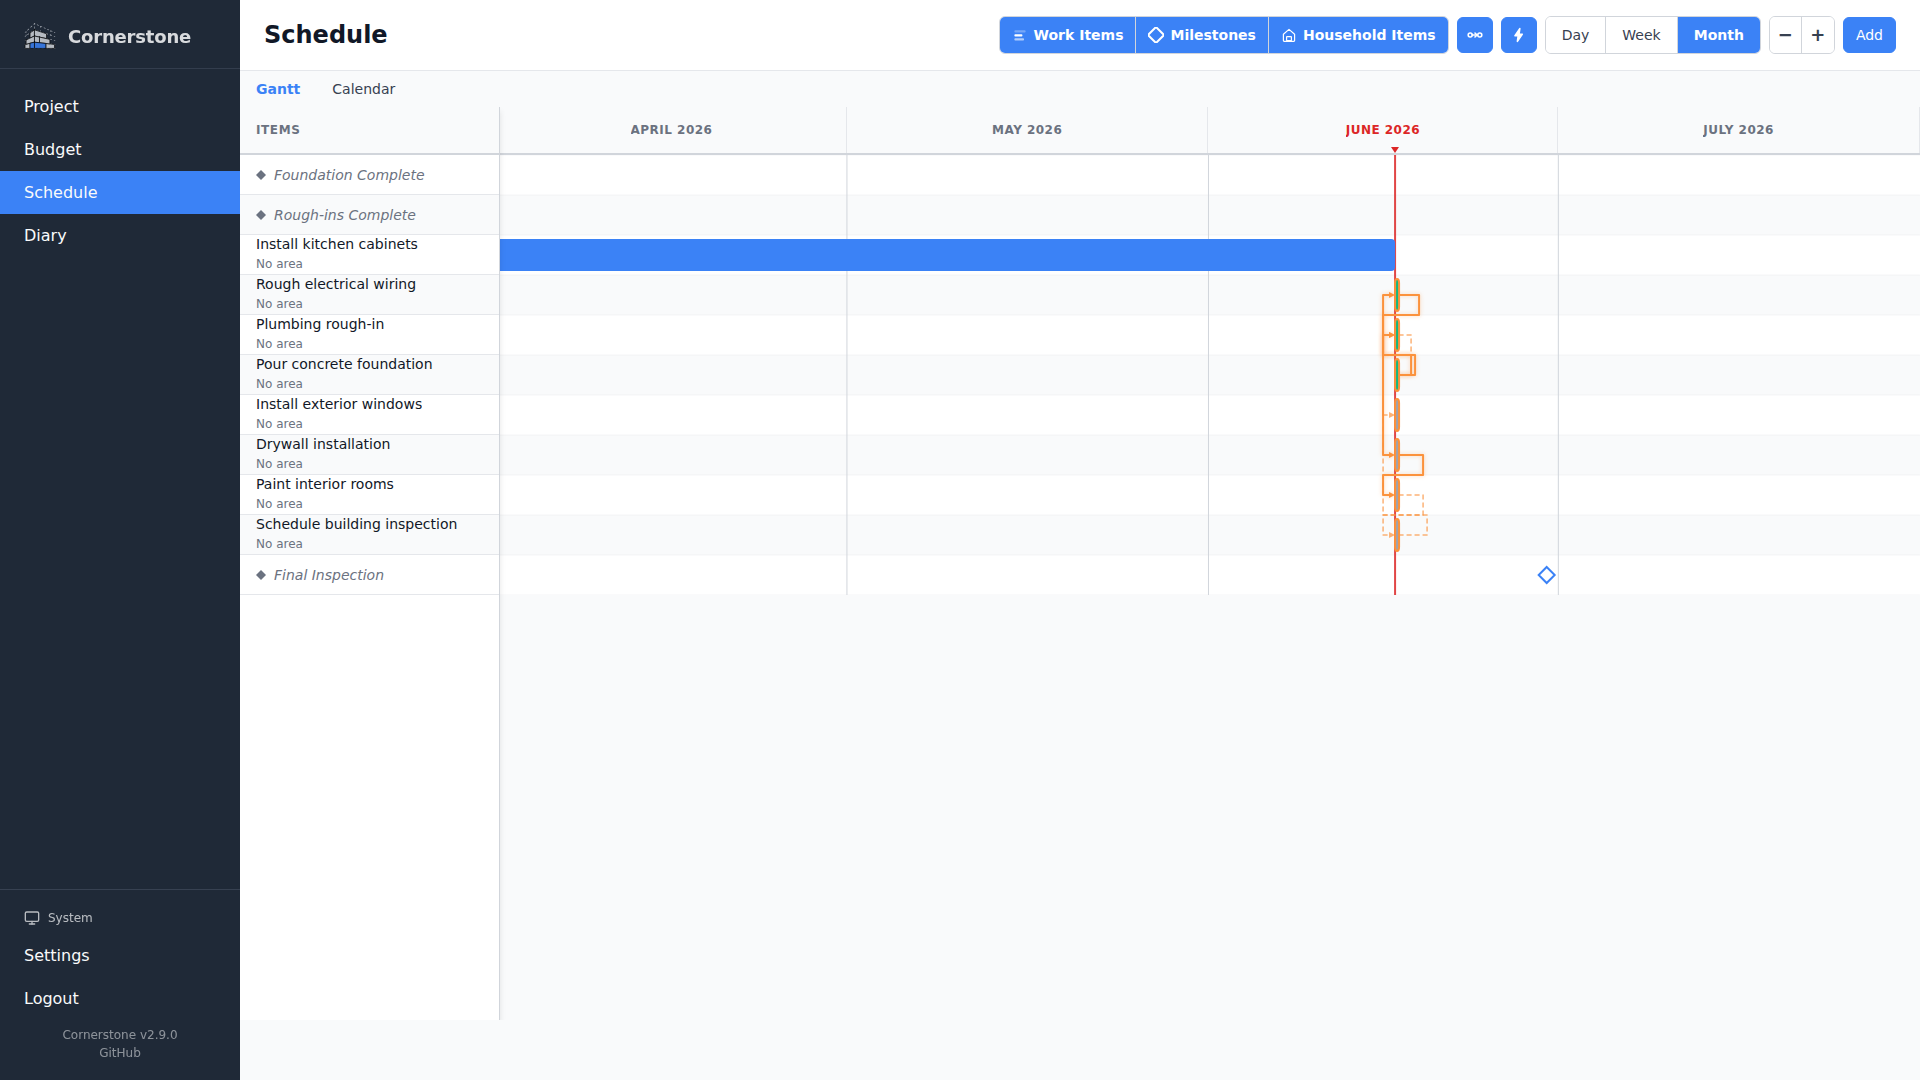
- Gantt Chart -- Interactive SVG-based visualization showing work items as horizontal bars positioned on a time axis, with dependency arrows, critical path highlighting, and zoom controls
- Calendar View -- Monthly and weekly grids showing work items as multi-day bars and milestones as diamond markers
- Milestones -- Named checkpoints with target dates that track major project progress points
- Scheduling Engine -- Automatic date calculations based on dependencies, duration, and constraints
- Auto-Reschedule -- Server-side automatic rescheduling of not-started work items when a new day begins
How It Fits Together
Work items that have start and end dates appear on both the Gantt chart and the calendar. Dependencies between work items determine the order of work and are visualized as arrows on the Gantt chart.
Milestones mark important checkpoints in your project. You can link work items to milestones so that the milestone's projected completion date reflects the latest end date of its contributing work items.
The scheduling engine uses the Critical Path Method (CPM) to calculate optimal dates for your work items, respecting all dependency relationships and constraints. When you trigger auto-schedule, it adjusts dates for not-started items to ensure dependencies are satisfied.
Next Steps
- Gantt Chart -- Learn about the interactive Gantt chart and its controls
- Milestones -- Create and manage project milestones
- Calendar View -- Navigate your schedule with monthly and weekly calendars